DADiSP Online Help
Click here to see this page in full context
Creates an XY plot with alternate X scales.
XYALT(x, xalt, y, scales1, scales2)
|
x |
- |
A series, the primary X values. |
|
xalt |
- |
A series, the alternate X values. |
|
y |
- |
A series, the Y values. |
|
scales1 |
- |
Optional. An integer, the primary X axis type. Defaults to 2, X bottom, Y left with labels. |
|
scales2 |
- |
Optional. An integer, the alternate X axis type. Defaults to 16, X top with labels. |
An XY series. The series is plotted with two sets of X axes.
W1: integ(gnorm(1000, 1));setvunits("V")
W2: xvals(w1)
W3: rev((xvals(w1)/100)^2);setvunits("N")
W4: xyalt(w2, w3, w1)
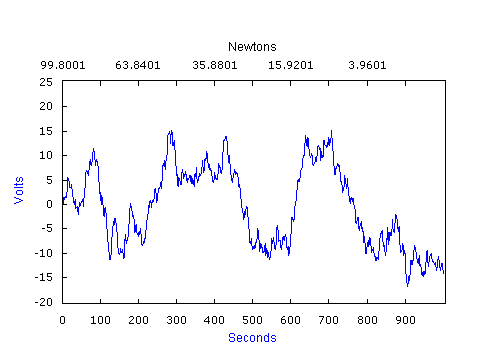
W4 contains an XY plot where the primary X values are in Seconds and derived from W2. The alternate X values are in Newtons and derived from W3. The resulting plot displays the primary X values at the bottom of the plot and the alternate X values at the top of the plot. The plot shows the corresponding Newton value for a given time value.
W1: integ(gnorm(1000, 1));setvunits("V")
W2: xvals(w1)
W3: rev((xvals(w1)/100)^2);setvunits("N")
W4: xyalt(w3, w2, w1)
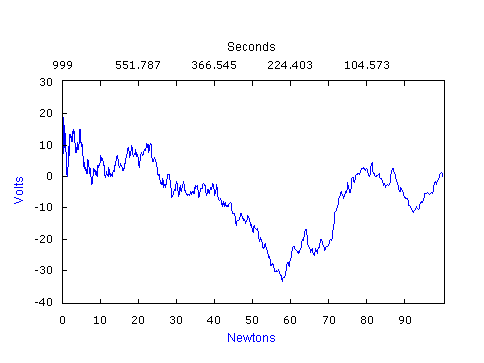
Same as the previous example except Newtons are the primary X values.
XYALT displays an XY plot with two sets of X axes. Because the alternate X axis is synchronized to the primary X axis, the alternate X axis tic values may not occur at a regular interval.
See SCALES for a description of the axes display options.